
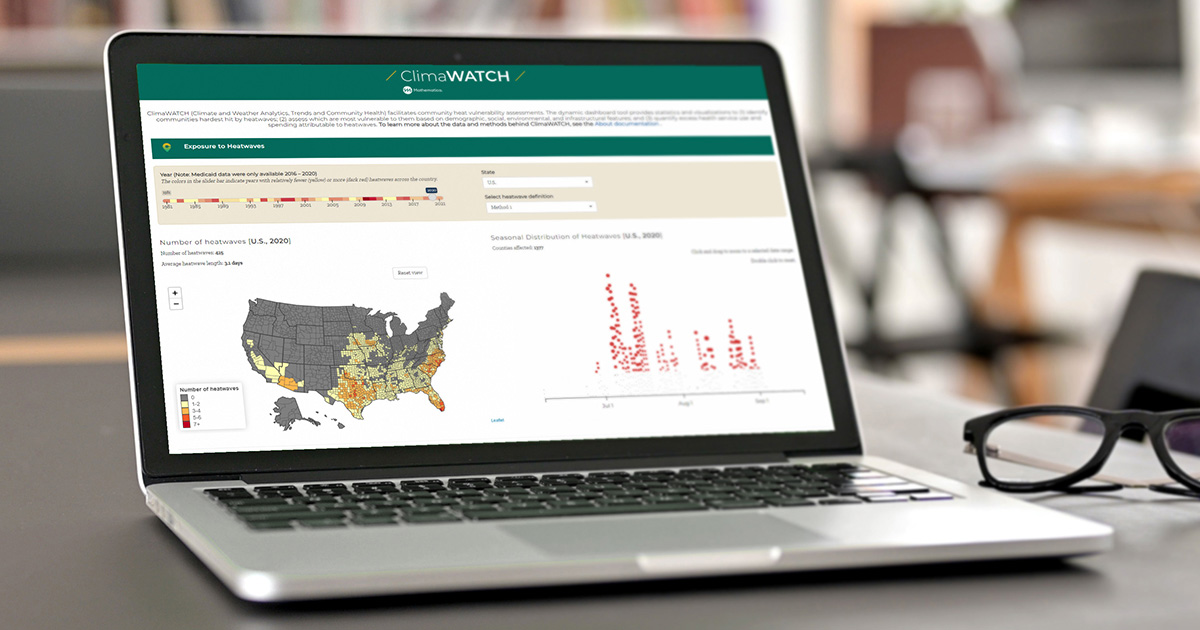
Today, Mathematica officially launched a new data dashboard that highlights how heat waves have impacted health care use and spending and magnified inequity across the country, focusing on Medicaid beneficiaries. ClimaWATCH (Climate and Weather Analytics, Trends, and Community Health) synthesizes and visualizes multiple data sources to make it easy for government officials, public health agencies, health care providers and others to explore relationships between heat-related exposure, vulnerability, and illness at the county, state, and national levels over time.
ClimaWATCH enables users to assess where heat waves and heat-induced health issues have concentrated, how socioenvironmental factors differ in counties with and without heat waves, and which communities have faced higher rates of direct and indirect health issues due to extreme heat. Communities can use the dynamic data summaries in ClimaWATCH—detailed by demographic group, care setting, and diagnosis—to better adapt to heat waves and rebound from them more quickly. For example, health care providers can use the tool to anticipate the magnitude of surges in health care utilization, so they can properly adjust staffing levels. Public health agencies can use ClimaWATCH to adapt municipal vulnerability planning to address climate-induced health inequities, and government officials can use the tool to focus resilience-building resources on high-risk communities.
“By synthesizing complex data on extreme heat, multi-dimensional vulnerability, and Medicaid claims, ClimaWATCH sheds light on factors that influence why some communities have more heat-related health issues and face higher treatment costs,” said Aparna Keshaviah, who led the design and development of ClimaWATCH as principal researcher at Mathematica. “Each year, billions of dollars are spent dealing with the impacts of heat waves across the country. ClimaWATCH can help communities tailor adaptation strategies to put resources in the right places at the right time to protect those most at risk for severe or fatal health issues.”
One in two Americans live in counties regularly exposed to heat waves, which are getting stronger, lasting longer, and are responsible for more deaths than any other weather-related hazard in the United States. With ClimaWATCH, officials can explore what prolonged exposure to extreme heat might mean for a range of health outcomes by using the tool’s enhanced features, including a sortable table that details how states and counties fare on exposure, vulnerability, and health outcome metrics.
ClimaWATCH brings together national Medicaid claims data, localized weather metrics, and indices that capture vulnerability related to counties’ demographic, social, geographic, environmental, and infrastructural features.
To learn more about ClimaWATCH, explore the tool, and contribute to this ongoing work, visit Mathematica's website. A forthcoming peer-reviewed paper will further examine how socioenvironmental vulnerability magnifies the impact of heat on health.
Contact
-
Colleen Psomas
cpsomas@mathematica-mpr.com