
Heat Vulnerability Assessments in California
Download
Key Findings
- In 2020, 57 of the state’s 58 California counties faced heat waves during which the daily average temperature was in the top 5 percent of all temperatures recorded since 1981.
- California counties with one or more heat waves in 2020 saw seven times more hospital visits for heat stress than the national average and faced excess Medi-Cal costs that were 11 to 12 times higher than the national average.
- In rural Tulare County, where outdoor workers make up 38 percent of the workforce, there were large increases in spending to treat heat stress in an inpatient setting, amounting to more than $21,700 per beneficiary (versus $742 per beneficiary statewide, on average).
- Using ClimaWATCH, health systems can develop tailored heat safety campaigns to educate patients and clinicians on how heat affects health, who is most affected, and how to recognize and address heat-related illnesses. Furthermore, tailored emergency heat protocols could help prevent heat stress and other acute conditions from becoming life-threatening or fatal.
Californians consistently see some of the highest temperatures in the country. Prolonged heat exposure can trigger wide-reaching harm—including droughts, wildfires, overloaded power grids, and infrastructure damage—costing the United States billions of dollars. Heat waves also cause or worsen a range of physical and mental health problems that result in surges in health care visits and costs, straining health system resources, overloading staff already burdened by California’s health workforce shortages, and threatening continuity of care.
Mathematica’s ClimaWATCH tool facilitates heat vulnerability assessments by identifying communities that have been hit hardest by extreme heat, pinpointing the root causes of vulnerability, and quantifying heat-related health effects. Using findings from ClimaWATCH, this brief clarifies how heat waves have affected the health of the 38 percent of Californians covered by Medi-Cal. The brief explores how heat-related illnesses and treatment costs vary over time; by diagnosis, subpopulation, and care setting; and across three California counties with different vulnerability profiles. It also highlights how ClimaWATCH can inform adaptation strategies and tailored, localized heat action planning.
Explore ClimaWATCH here.
More like this from Mathematica
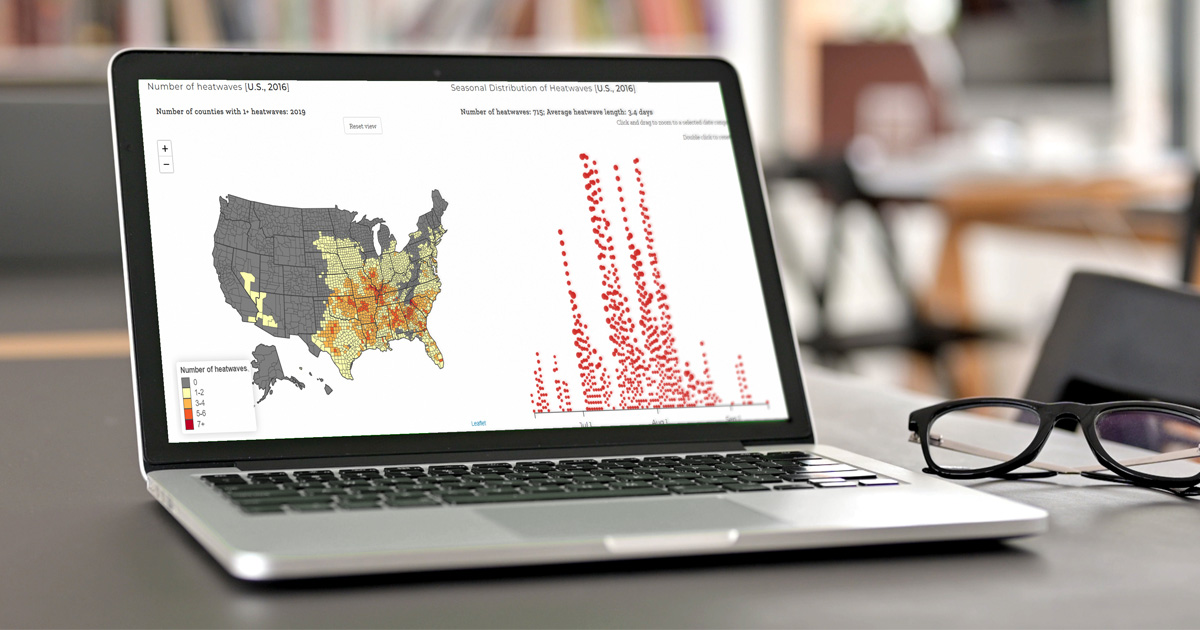
Featured Data Visualization
ClimaWATCH: An Interactive Tool for Climate Vulnerability Assessments
How do you apply evidence?
Take our quick four-question survey to help us curate evidence and insights that serve you.
Take our survey