

Rural hospitals are experiencing a crisis. In the past decade, financial distress has led to an increase in rural hospital closures, leaving residents of those areas with reduced access to care and exacerbating rural-urban health disparities that already existed. The Centers for Medicare & Medicaid Services (CMS) and other health care payers are supporting efforts to change financial incentives for rural hospitals to enable transformation of care while maintaining access in rural areas. In the past few years, our multidisciplinary team of researchers, data scientists, and analysts at Mathematica has been working with federal and state partners to explore the potential of alternative payment models to achieve those goals.
One example is the Pennsylvania Rural Health Model, which the CMS Innovation Center launched in 2017. Under this model, CMS (and other payers) pay participating hospitals a fixed amount using a prospectively calculated global budget that covers all inpatient and hospital-based outpatient services; these hospitals are also held accountable for a targeted set of quality measures. Mathematica partnered with Pennsylvania to implement the model and provide program support, such as helping hospitals assess their financial opportunities under global budgets.
Our experience in Pennsylvania taught us that the global budget payment model can provide a powerful incentive for hospitals to reduce potentially avoidable utilization (PAU) by improving the population health in their local communities. Generally, PAU refers to acute hospital care (inpatient stays and emergency department visits) that could have been prevented with high quality health care services outside of a hospital setting, such as timely access to ambulatory care, improved care management, and better care coordination among providers. Because hospital care represents the largest component of health care spending in the United States, policymakers and health care payers are increasingly interested in reducing preventable or avoidable hospital use. Under global budgets, hospitals can maintain financial health while working on population health initiatives because hospital payments are no long dependent on the volume of services provided.
As new payment models are creating incentives to improve population health by focusing on PAU at hospitals, we wanted to better understand the relationship between avoidable hospital use and the overall health of the community in rural areas. Using data from 2019 Medicare fee-for-service Part A and Part B claims, we calculated the proportion of hospital revenue attributable to PAU for all rural hospitals in the United States. The PAU rate captures three metrics: (1) readmissions back to the same hospital for any cause within 30 days of discharge, (2) admissions for ambulatory care sensitive conditions, and (3) potentially avoidable emergency department visits. We then linked the PAU data with county health rankings and used the overall health factor ranking to assess the population health of a hospital’s county. The health factor ranking is designed to reflect how well a county is doing on modifiable factors, including health behaviors, clinical care, socioeconomic factors, and the physical environment. Counties are ranked from 1 to 4 (from healthiest to least healthy) based on their overall score relative to scores for other counties in the same state.
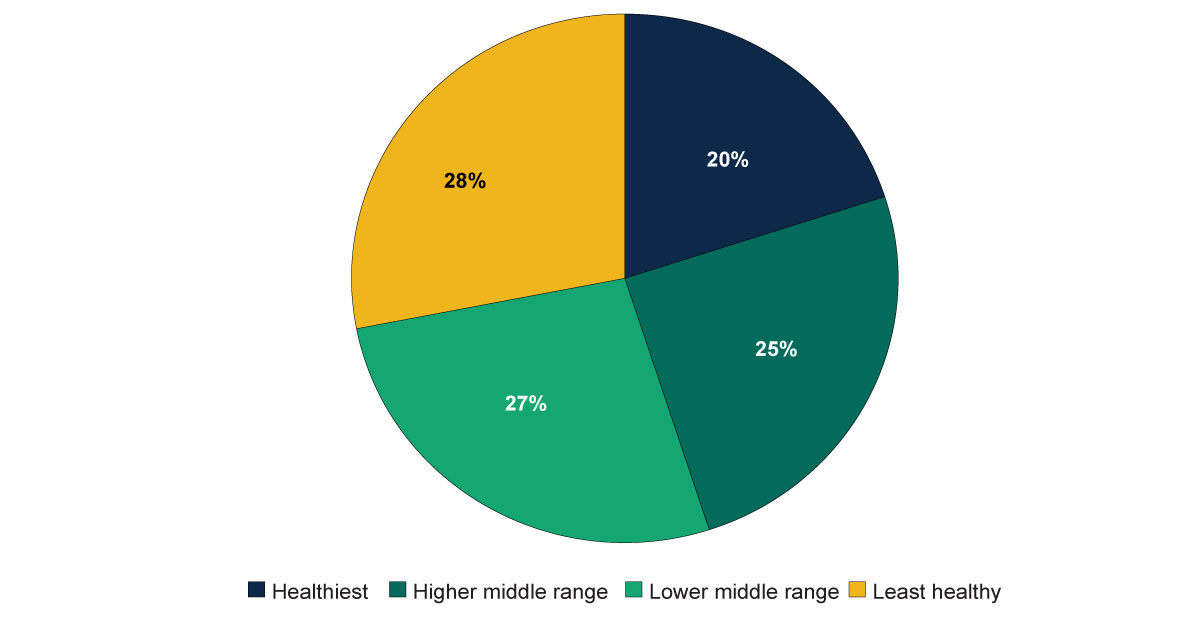
As illustrated in the pie chart above, rural hospitals tend to be in counties with relatively poor population health. Specifically, more than half of rural hospitals are in counties in the bottom two health ranks. Only 20 percent of rural hospitals are in counties ranked as the healthiest in their states.
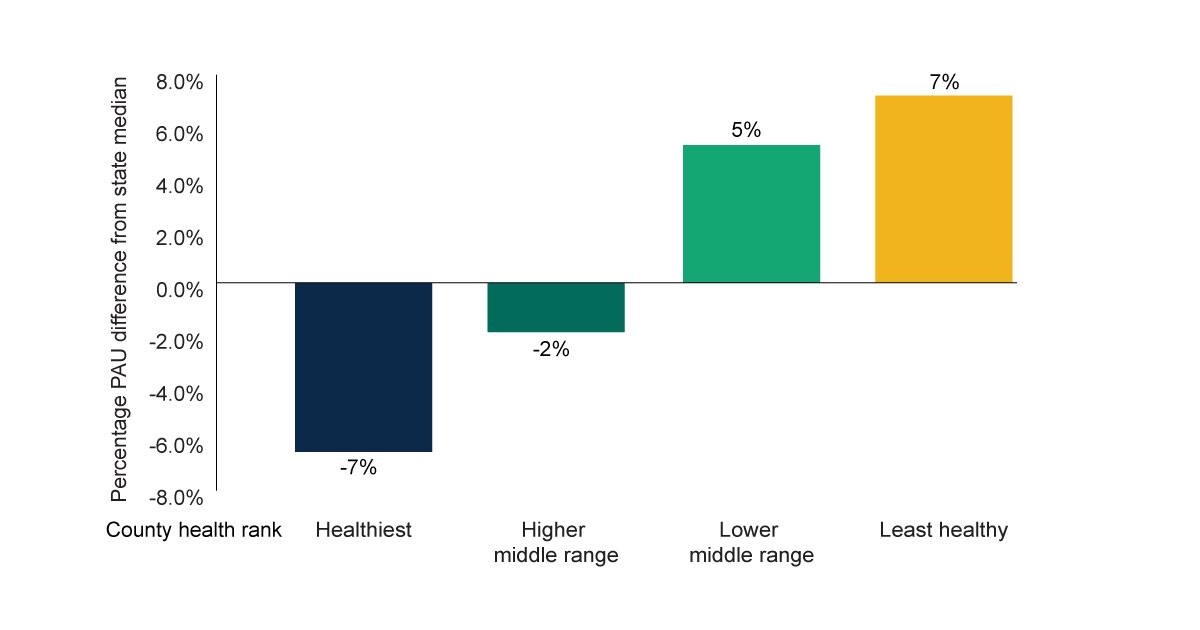
PAU rates vary widely across rural hospitals, and many factors—such as geography, the underlying patient population, and the types of services provided by the hospital—contribute to that variation. However, the data suggests that a county’s population health has a sizable effect on hospital PAU rates. The bar chart above shows that, on average, hospitals have a PAU rate 7 percent higher than the state median if they rank at the bottom for county health. On the other end, hospitals have a PAU rate 7 percent lower than the state median if they rank at the top for county health.
Our analysis suggests that focusing on reducing PAU rates in rural communities can provide a useful strategy to link hospital services with population health strategies in the community. Examples of promising interventions that rural hospitals may consider implementing include expanding access to low-cost medications for blood pressure control, increasing access to tobacco cessation treatments, and community-wide interventions such as improving public transportation, and introducing multi-component worksite programs to prevent obesity.
Finally, new payment models, such as the Pennsylvania Rural Health Model and the upcoming Community Health Access and Rural Transformation Model, might offer the right incentives for rural hospitals to establish sustainable partnerships with their local communities to align strategic plans for improving population health. Under a predictable fixed budget, improved population health would not only bolster the hospitals’ financial position, it could enable hospitals to invest more in quality improvements to further improve the health of rural residents.
This study is part of an ongoing initiative at Mathematica to analyze Medicare claims-based data to support decision making in health care system transformation. As a next step, we plan to release an interactive dashboard that enables users to query PAU rates for a single hospital and compare a hospital’s PAU rates with its state benchmarks.