
As schools around the country begin the 2020–2021 school year, COVID-19 remains a threat. The possibility that schools could exacerbate the pandemic is a serious concern. In some communities, local infection rates are high enough that schooling must be conducted remotely. But keeping school buildings closed creates educational, social and emotional, and economic harms, creating wrenching trade-offs in communities with low or moderate infection rates, where leaders must determine whether, when, and how to open school buildings while mitigating spread of the virus, all in the face of enormous uncertainty.
Although there is no one-size-fits-all solution to this challenge, our recent work in Pennsylvania provides a road map to help school and community leaders all over the country create operating, quarantine, and closure strategies that—where local infection rates are not prohibitively high—can allow students to attend in person while minimizing the risk of outbreaks.
Working with the Pennsylvania Department of Education, we conducted 400,000 simulations using an agent-based computational model to predict the spread of infections in schools for hundreds of combinations of local circumstances and school operating and quarantine strategies. This project builds on previous work with the support of the U.S. Department of Education’s Regional Educational Laboratory Mid-Atlantic. In that work, researchers found that part-time hybrid operating strategies where students are divided into groups that attend school separately could substantially slow the spread of infections.
Our new modeling expands on those findings in several ways:
- We examined how infection spread in schools is affected not only by the school’s operating strategy, but also by the local community infection rate and the way the school responds to detected infections.
- We examined the extent to which school schedules are likely to be disrupted with different infection-control strategies.
- We customized results for 108 different school situations, varying by grade level, school size, community infection rate, operating strategy, and response to detected infections, so that nearly any school can find relevant data for its circumstances.
Our simulations confirm that precautions including wearing masks and eliminating additional mixing of students outside of class can substantially reduce the spread of infection in schools.
Moreover, the new simulations show the spread of infection can be dramatically mitigated when precautions are combined with part-time hybrid operation. Such a combination reduces the number of contacts by each student, allows more physical distance between students in class, and reduces the number of days in which contact occurs in the school. Our latest findings suggest that under a hybrid approach with carefully implemented precautions, most of the infections occurring outside of the school would produce zero additional transmissions in the school.
"New simulations show the spread of infection can be dramatically mitigated when precautions are combined with part-time hybrid operation."
Beyond these general findings, we wanted to make this evidence as accessible and useful as possible to individual school leaders facing the difficult decisions in front of them. That’s why we broke out results for elementary and secondary schools, for schools in communities with four different levels of community infection rates, for schools operating full time and in part-time hybrid approaches, and for schools using different approaches to respond to detected infections. These customized results create scenarios that just about any school in the country can use to predict the likely outcomes of various operating approaches and responses.
Let’s take a look at a few examples, to see what the results can show school leaders. The results are organized by school type (elementary, typical secondary, and large secondary) and by community infection rate (10, 25, 50, or 100 reported infections per 100,000 residents over the past week). School leaders can find the page in the report that is relevant to their own school type and community infection rate. Because most expert guidance recommends school buildings be closed in communities with rates above 100 per 100,000 residents over the past week, we do not present results for communities with higher infection rates.
Our first example is of a large secondary school in a community with a moderate infection rate of around 50 per 100,000 over the past week—similar to recent averages in states such as Ohio, Michigan, and California, and somewhat higher than recent averages in Pennsylvania, Massachusetts, and Colorado. When we turn to the page of the report corresponding to large secondary schools with that community infection rate, we find comparative results for three different operating approaches and three different approaches for quarantine and/or closure in response to infections (a total of nine combinations of operating and quarantine/closure practices).
The three operating approaches, represented by different colors on each graph, are:
- Full-time, business-as-usual, without precautions (green bars)
- Full-time with masks and reduced student mixing (blue bars)
- Part-time with masks and reduced student mixing, with students divided into two groups, each of which attends two days a week (yellow bars)
The three different ways that a school might respond when a COVID-19 case is detected, represented by different shades of each color, are:
- Quarantining close contacts of the infected person without school closure (lightest shade)
- Quarantining close contacts of the infected person with a 3-day closure for deep cleaning (middle shade)
- Quarantining close contacts of the infected person with a 14-day closure (darkest shade)
The first chart (below) shows the relative number of infections that a school might experience among its students and staff over the course of the school year, with comparative results for the nine possible combinations of operating scenarios and quarantine/closure approaches.
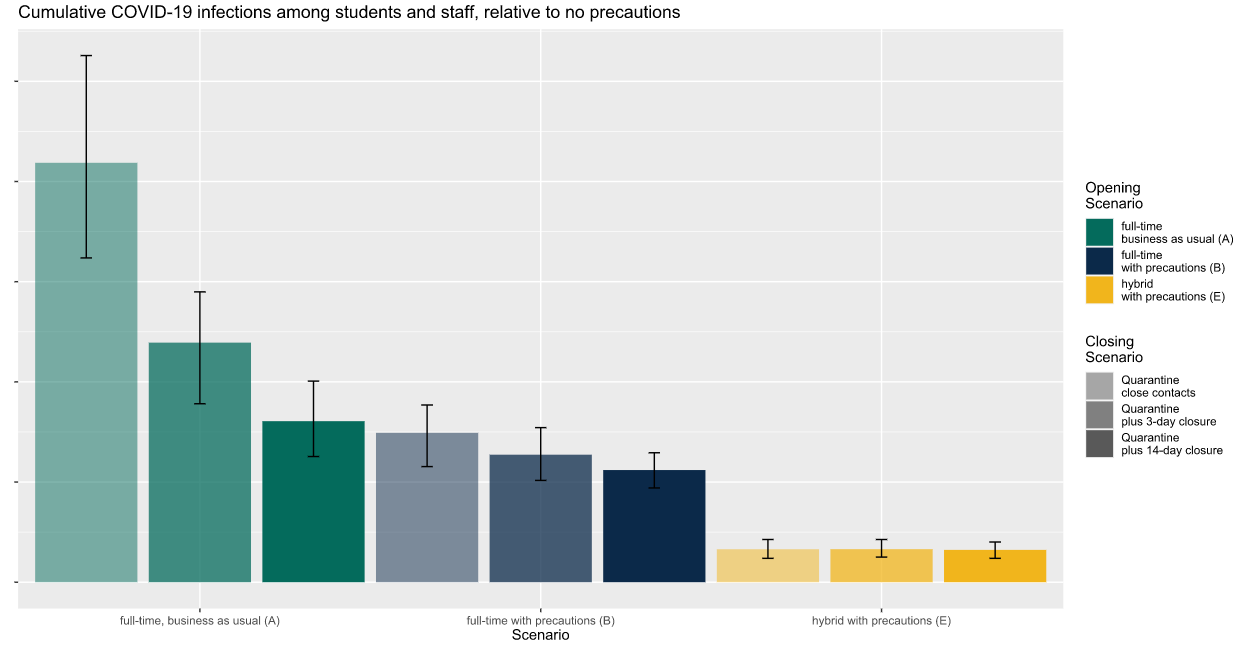
So, what does this tell me, as a leader of a large secondary school in a community with a moderate infection rate? First, implementing precautions is likely to reduce my school’s infection rate (evident from lower infection rates for blue bars relative to green), and part-time hybrid instruction is likely to reduce my school’s infection rate quite a bit more (evident from lower infection rates for yellow bars relative to blue). Second, if my school is operating with a part-time hybrid approach, there is no evident benefit to shutting the school down rather than simply quarantining close contacts. Closing the school in response to infections matters a lot more if my school is operating full time without precautions, where cumulative infections decline substantially when the school shuts down each time an infection is detected.
“If my school is operating with a part-time hybrid approach … there is no evident benefit to shutting the school down rather than simply quarantining close contacts.”
The next chart shows the percentage of in-person days the typical student is likely to be able to attend, for the same nine combinations of operating and quarantine/closure approaches. The percentage of school days that each student can attend in person would be reduced by school closures, of course (more for a 14-day closure than a 3-day closure), but it would also be reduced by quarantines of close contacts—which will occur more frequently if the school experiences more infections. The chart includes a solid line at 100 percent, which is impossible to achieve in a large secondary school in a community with a moderate infection rate, as none of the bars reaches even 90 percent here. The chart also includes a dashed line at 40 percent, which is the theoretical maximum percentage of days a student could attend in person in a school operating with a 2-day-per-week hybrid approach (yellow bars).
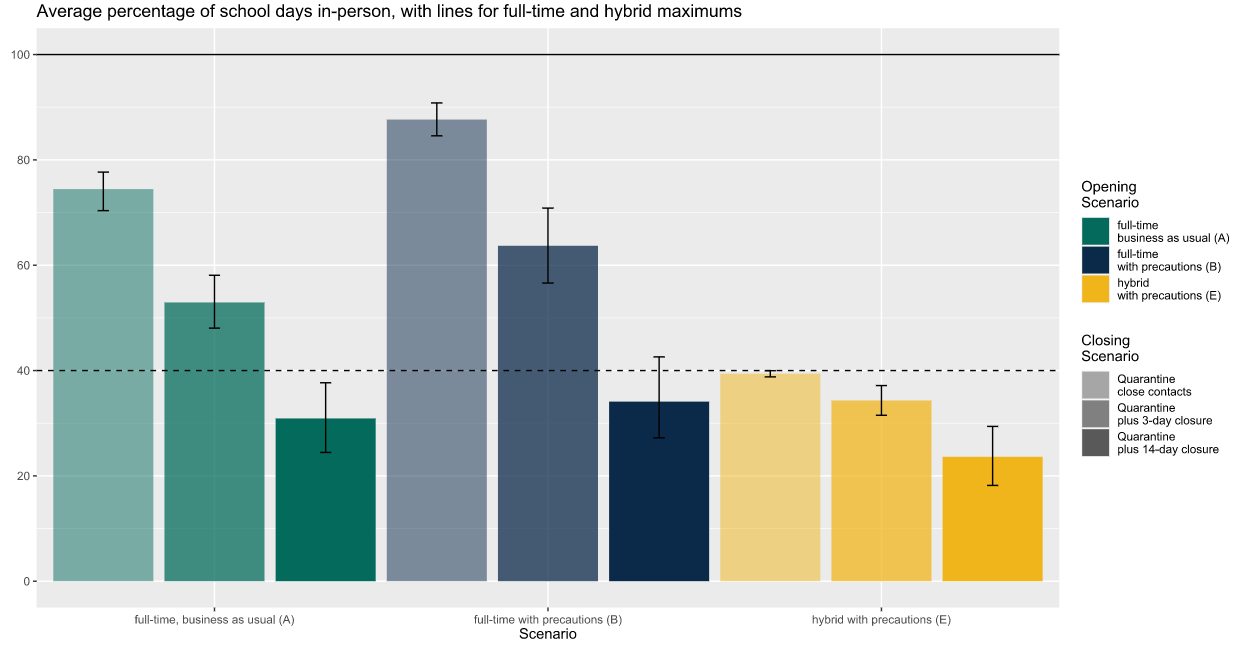
In a large secondary school in a community with moderate infection rates, the typical student can attend in person more days if the school building is open full time with precautions (blue bars) than with the other two operating approaches (full time without precautions or part-time hybrid). We also see, not surprisingly, that school closures reduce the number of days that the typical student can attend regardless of which operating strategy is in place, as indicated by the decline in the height of the bars as we move from left to right (lighter shade to darker) in each color. Indeed, in a school trying to operate full time but which closes for two weeks every time an infection is detected, the typical student would be able to attend only about 30 percent of school days over the year (dark green and dark blue bars). In contrast, the typical student attending a school operating on a part-time hybrid model that quarantined close contacts without closing down entirely could expect to attend reliably nearly every single day the school intended its building to be open (as indicated by the lightest yellow bar nearly at the 40-percent maximum).
Finally, the third chart illustrates the likely number of total infections in a school at the time the first infection is detected. This is an important number because many people who are infected have no symptoms, either because their symptoms have not yet started (presymptomatic) or because they are among the lucky ones who do not experience symptoms.
Again using the example of a large secondary school in a community with a moderate infection rate, we can see that undetected infections are highest for a school that is open full time with no precautions and lowest for a school using a hybrid approach with precautions. For this outcome, size matters: large schools are likely to have more hidden infections than smaller schools just because they are larger, with more people infected outside the school. But the graph shows that the operating strategy matters too: Infections generally spread faster in schools open full time with precautions (blue) versus part time with precautions (yellow), and faster still in schools operating full time without precautions (green). In large secondary schools operating full time without precautions in communities with moderate infection rates, we predict there will be an average of 10 infections in the school at the time the first one is detected.
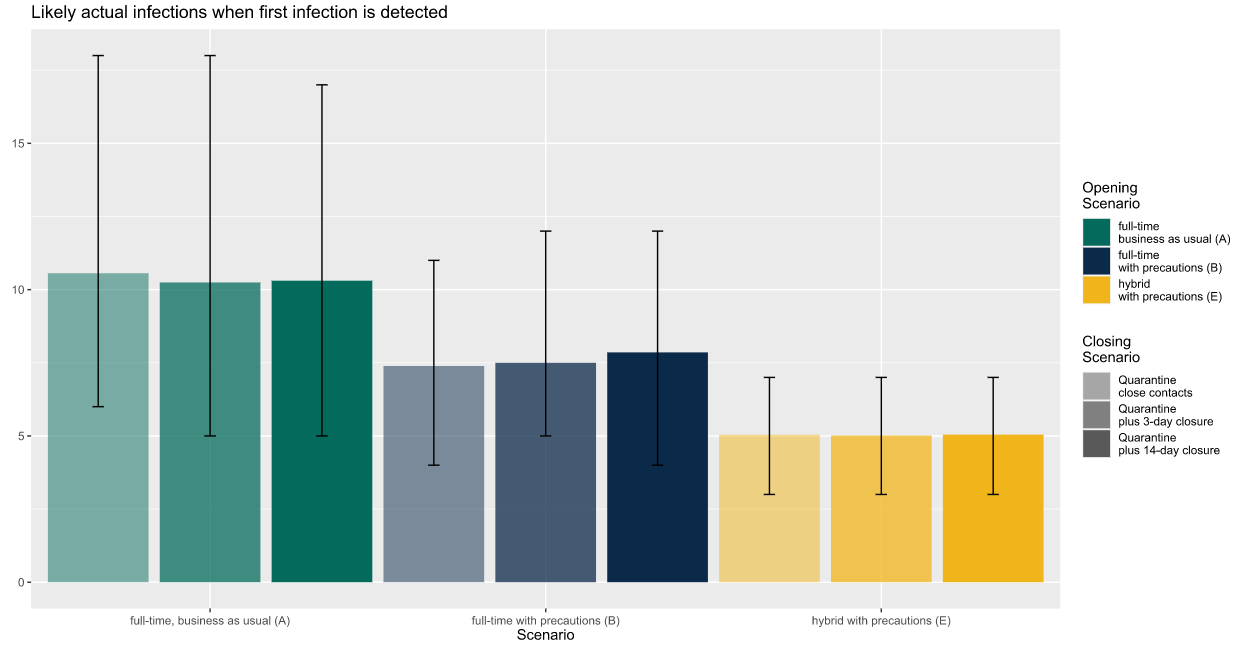
There is one other thing to notice about this chart, which is related to the “whiskers” that stretch above and below each bar. Those whiskers measure the random variation that is an inherent part of disease transmission, showing the range between the lucky school at the low end (5th percentile of the distribution) and the unlucky school at the high end (95th percentile of distribution). No school can count on landing at the average, and the whiskers here suggest that for some schools, the true number of infections at the time of the first detected infection could be substantially higher than the average.
We chose a secondary school for our example because the latest evidence suggests that the relative risk of infection is lower for students in elementary schools than for students in middle or secondary schools. Thus, the operating and closing strategies that school leaders choose are likely to matter more for the education and safety of students in middle and secondary schools. Nonetheless, elementary school leaders will find a range of scenarios that apply to their situations, and the main findings hold true: using precautions and a hybrid operating strategy can reduce infections, even among a younger student population already at lower risk of infection.
In March, schools across the country were caught off guard by this pandemic and made the transition to remote learning without much planning or preparation. In the months since, we have learned a great deal about how the virus is (and isn’t) transmitted. Based on what we’re learning, education leaders can use our findings to put themselves in a far better position now to make an evidence-informed decision about schooling in their communities. One thing is clear: Every school that is opening its building to students—part time or full time, starting now or later in the school year—needs to prepare for the likelihood that a student or staff member will become infected with COVID-19, and have a plan in place for what to do next.
The scenarios outlined here are just a few of the hundreds of combinations we looked at. More information about likely outcomes in schools similar to yours is available in our full report.