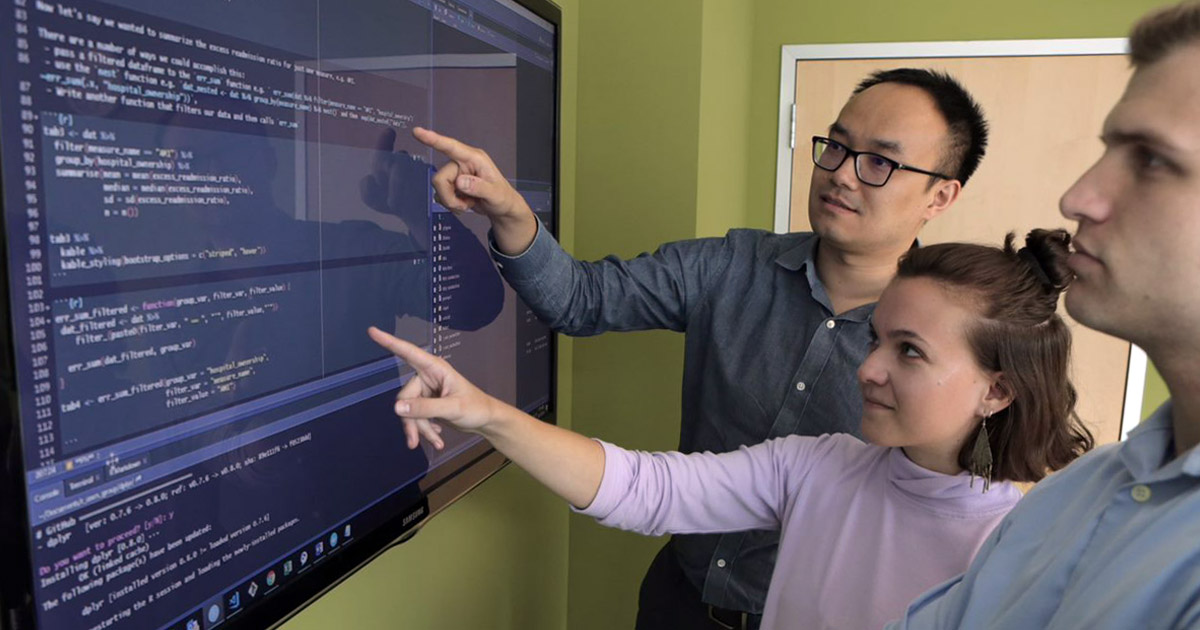
When I graduated with a Ph.D. in mathematics in 2013, I saw two paths available to me. I could enter academia, where I might teach courses about probability and research stochastic processes and their applications. Or I could apply my training in probability for real-world uses. At the time, Mathematica had a position open for a statistician, and I decided I couldn’t pass up the opportunity to apply my skills to improve public well-being for important clients such as the Centers for Medicare & Medicaid Services, the U.S. Department of Education, and the U.S. Department of Agriculture. In those early days, data science was still a relatively new field, and people saw big data as a vague concept or just a buzzword. I didn’t know that I would become the company’s first data scientist or that the merging of computer science and the social sciences would become such a large and important part of Mathematica’s evolution.
As a mathematician by training, I am fascinated by the ways we can match mathematical models to real-life data, discover unknown patterns in an existing system, and improve the status quo. I still remember my excitement, working as a summer associate at the National Institute for Computational Sciences in the Oak Ridge National Laboratory, at discovering the pattern of hotspots where researchers tended to experience long wait times while using a supercomputer. We developed mathematical models to investigate, monitor, and forecast supercomputer performance and user behaviors. Based on those models, we provided data-driven guidance for supercomputer users to properly select computing resources, shorten their queuing time, and make the processes more efficient for researchers to tweak and submit computational tasks to the supercomputer.

Fei (left) presented the auto-coding algorithm and results to the client from the National Center for Science and Engineering Statistics at the National Science Foundation headquarters.
My passion for using data-driven modeling to improve operational efficiency continues at Mathematica. For example, I’m on a team at Mathematica helping the National Center for Science and Engineering Statistics, a data clearinghouse for the National Science Foundation, with education and workforce surveys, which are critical for understanding the continued rise and expansion of the knowledge and innovation economy. As part of that work, we developed an auto-coding algorithm to facilitate the occupation coding process in a national longitudinal survey. Specifically, the auto-coding algorithm contains multiple modules to automatically assign occupation codes to survey responses. Currently, the National Center for Science and Engineering Statistics requires manual coding on most of its survey responses’ occupation codes. The algorithm we developed could automatically code more than 78 percent of these manually coded records, with an accuracy of up to 96.3 percent. The algorithm provides a way to automate the occupation coding process, reduce labor costs, and accelerate the publication of key statistics that can inform policymakers, researchers, advocates, and the media about trends in education and the workforce. Based on the success of the auto-coding algorithm on past survey responses, we are working with the center to deploy the model using a data-centric approach on this national survey for future occupation coding efforts.
With colleagues from various specialties and cultural backgrounds, Mathematica truly is a melting pot: people with very different professional backgrounds join a project team to help our clients solve policy research questions and accomplish our mission of improving public well-being. As a data scientist, working closely with subject matter experts deepens my understanding of the big policy picture and data nuances, which helps make sure the data science solution harmonizes with existing settings in related programs. For example, we recently worked with a state regulatory agency to assess its methodology to group hospitals into peers for comparing their costs. In this project, data scientists regularly met with in-house health economists and policymakers from the client to review and assess current methods, co-design analytic approach to navigate alternative peer-grouping method and develop additional adjustments to measure hospital efficiency, compare modeling results, and discuss their potential implications for the policies. By doing so, we made sure the updated measure was evidence-based and statistically robust and that it supports hospitals providing care for disadvantaged populations while determining high-cost providers.
In addition to advancing my professional career as a data scientist in the policy research world, the diverse and inclusive culture at Mathematica has encouraged me to foster a similar culture in other communities to which I belong. For example, I play a trick-taking card game called Tractor (a simpler version of Bridge) for leisure. I am obsessed with the game because of its elegant form and the opportunity it affords me to exercise strategic thinking, logical calculation, and strong teamwork. When organizing Tractor events and tournaments, I always try to achieve the principle of parsimony (also known as Occam’s razor), foster an inclusive and diverse culture to develop a strong and sustainable community, and develop rules to nudge participants to pursue the value of this game and protect equity during the competition. These goals align with my goals at Mathematica: look for the simplest data science solution to a problem; foster a work environment in which a diversity of thought, experiences, and expertise are welcome; and achieve better, fairer outcomes for people affected by public policies and programs.

Fei presented trophies to champions of past Tractor tournaments during a community event.
Since joining Mathematica in 2013, I witnessed the growth of data science in many areas of Mathematica’s research work. With the advances of technology and cloud computing, the potential and capacity of scaling data science for social good are enormous. I am very proud to be part of a wonderful organization that pursues the shared mission of using data science to help shape an equitable and just world using evidence-based decisions.


