On any given day, many people interact with a wide variety of support services to meet their unique and complex needs. A student at risk of dropping out of school might receive after-school tutoring from a program funded by one agency, case management services through a different organization, and also participate in a non-profit mentoring program. Although researchers and policymakers sometimes view programs like these as separate from one another, diverse service providers frequently serve many of the same people under a common mission. Network analysis methods offer opportunities to better understand the bigger picture of how different services form an interconnected system of support.

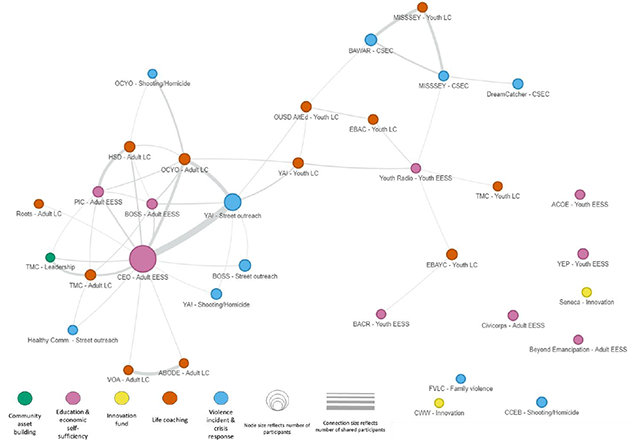
A graphical representation of the Oakland Unite network of service providers.
Take our recent work with Oakland Unite, a taxpayer-funded initiative to prevent violence in Oakland, California. Oakland Unite awards $6.7 million annually to 26 community-based agencies. These 26 agencies provide a range of services under five different violence prevention strategies and together form a citywide service delivery system for people at highest risk of experiencing or engaging in violence.
For example, someone who has been injured in a gang-related incident might get immediate support from Oakland Unite shooting response staff at the hospital. After the person is discharged from the hospital, the shooting response staff might refer them to an Oakland Unite agency providing longer-term life coaching to help re-direct them away from violence. Depending on the person’s needs, their new life coach might refer them to Oakland Unite-funded employment and education services that offer job skills and placement support.
Although each Oakland Unite agency tracks client and service information in a central database, officials were not able to tell whether or how different agencies worked together at a systems level to meet people’s needs. That’s when we turned to network analysis, a data science method used to analyze how entities are interconnected. Network analysis has been used to study a wide variety of social structures, from disease transmission to organized crime, and it can also be used to evaluate how programs are working. What sets network analysis apart from other methods is its focus on characterizing and understanding connections—the partnerships central to many service delivery systems that are designed to jointly address the varied needs of the people they serve.
To explore agency connections in Oakland Unite, we used administrative data to create a graphical representation of the Oakland Unite network in which agencies are linked to each other based on the number of clients they share. Agencies are represented as dots whose size and color indicate the total number of clients they serve and their violence prevention strategy, respectively. The width of the lines connecting two agencies reflects the number of clients they share. Dense and overlapping connections indicate more highly connected agencies, while agencies without any connecting line share few or no clients.
Although we can tell just by looking at the network visualization that some agencies are more connected than others, we used statistical tests to explore whether agencies working in certain violence prevention strategies are more likely to share clients than agencies in other strategies. We found that agencies offering life coaching, education and economic self-sufficiency, and street outreach services to adults have a greater number of connections compared to the average number of connections across the network—precisely as Oakland Unite officials hoped. But we also found that agencies are more likely to share clients with agencies providing similar services than with agencies offering different violence prevention strategies, suggesting there is room for greater cross-strategy collaboration.
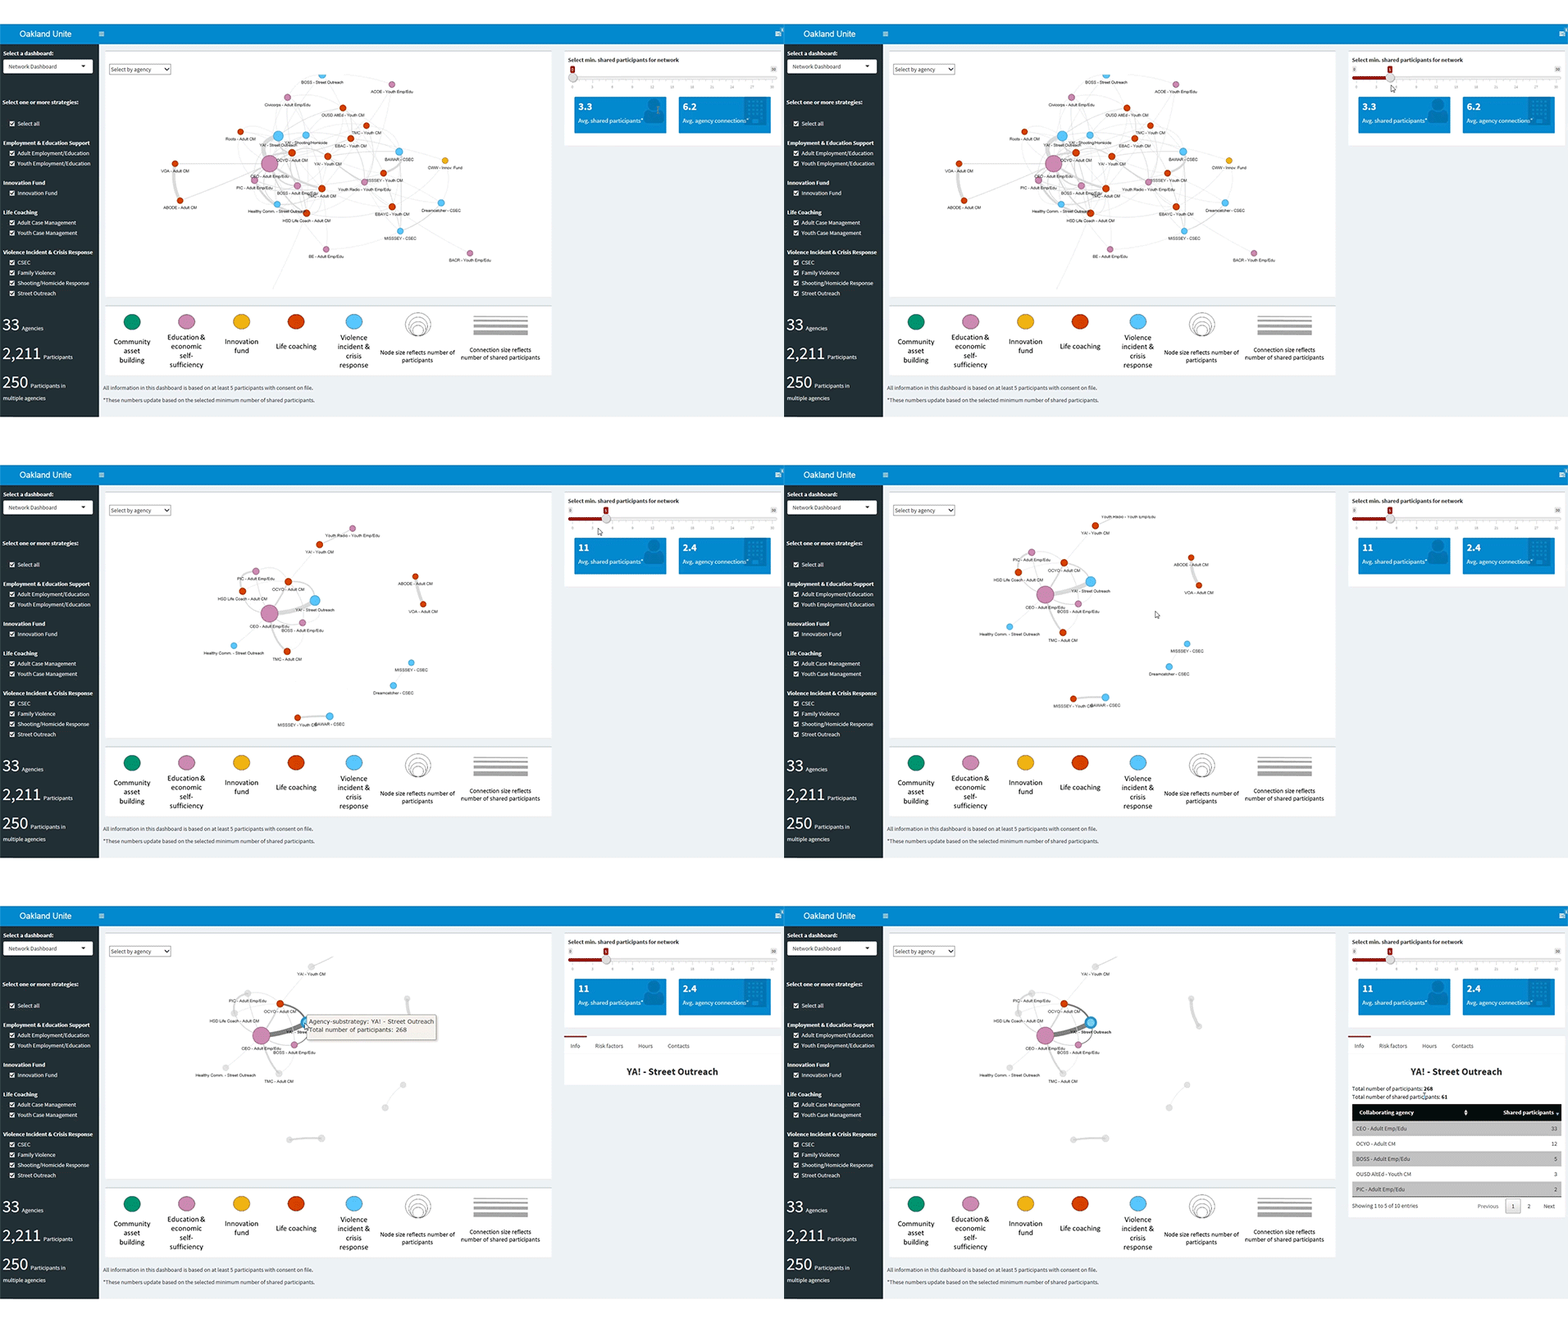
To help Oakland Unite officials better understand their network of agencies and how clients interact with them, we created an interactive online dashboard. Using the dashboard, Oakland Unite staff can filter on agencies or strategy areas of interest, define connections (for example, requiring more than ten shared clients), drag and zoom within the visualization to get a better look at a part of the network, and drill down for additional data about the clients who form the connections. The end result is that officials can see Oakland Unite agencies as an interconnected system rather than just 26 separate entities.

In addition to providing new, easy-to-understand information about client sharing across agencies, the network analysis generated new questions that helped shape the rest of our evaluation of Oakland Unite. For example, we can now analyze service data to see if client sharing reflects collaboration between agencies that provide complementary services or client churn as people jump across similar agencies in search of the right fit. Similarly, we can include questions about client sharing in our interviews with agency staff to better understand the nature of existing connections and identify barriers to greater cross-strategy collaboration.
Oakland Unite is just one example of how network analysis can be used to study an interconnected system of service providers, regardless of the service area. We’re also applying a similar approach through our work on Comprehensive Primary Care Plus, where we’re looking at the connections between medical providers, social services, and community-based organizations to see how they coordinate care for people with complex needs. These projects highlight how data science methods can shine a light on important but otherwise hidden connections between diverse service providers, helping us understand how people are really being served at a systems level.


