

Equitable access to education is the first step in ensuring that all students can succeed, but school discipline practices sometimes exacerbate academic disparities. Across the country, Black students and students with disabilities experience exclusionary discipline—that is, they are suspended and expelled from school—at higher rates than other students.
As the first state to join the new REL Mid-Atlantic addressing disproportionality in discipline alliance, Maryland is working with REL Mid-Atlantic to better understand the extent to which discipline disparities exist in its schools and districts, identify schools with disproportionalities in exclusionary discipline, and provide additional support to districts in which disparities are particularly acute. Our new report on school discipline in Maryland found that the state is not exempt from the nationwide problem of disproportionately high disciplinary removals for disadvantaged student groups. Even though disciplinary removal rates declined for all student subgroups in Maryland over the past decade, we found the following disparities:
- Black students and students with disabilities attending Maryland public schools were 4 percentage points more likely to be removed than other subgroups when committing the same offense in the same school.¹
- Non-White students—Black, Hispanic, American Indian, Alaska Native, Native Hawaiian, Pacific Islander, and multirace students—were removed from instructional settings for longer periods of time than their White peers on average.²
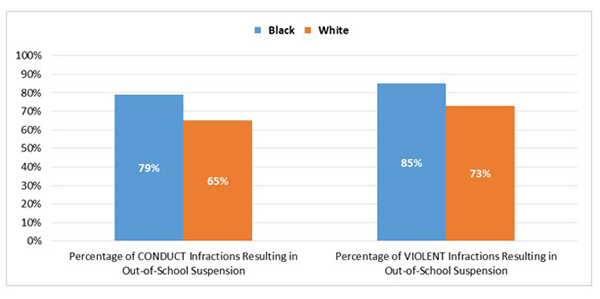
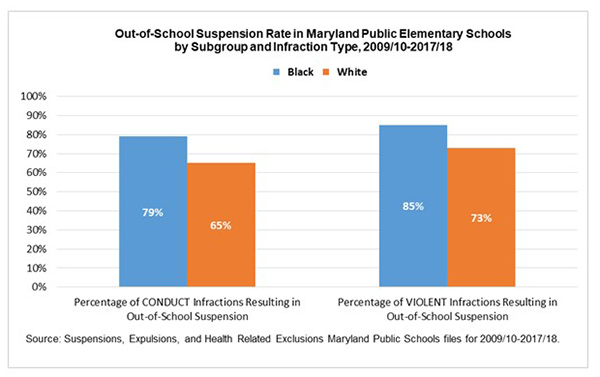
For example, at the elementary level, 79 percent of conduct infractions—offenses such as violating the dress code or disrupting the classroom—from Black students resulted in out-of-school suspension. By contrast, 65 percent of conduct infractions from White students resulted in suspension.
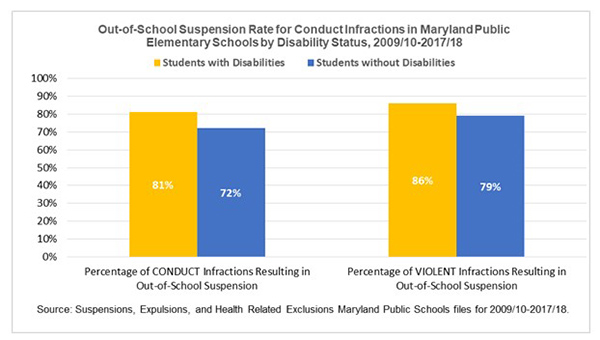
Students with disabilities were also suspended at higher rates than their peers. For example, 81 percent of conduct infractions from students with disabilities at the elementary level resulted in out-of-school suspensions compared with 72 percent of conduct infractions for students without disabilities.
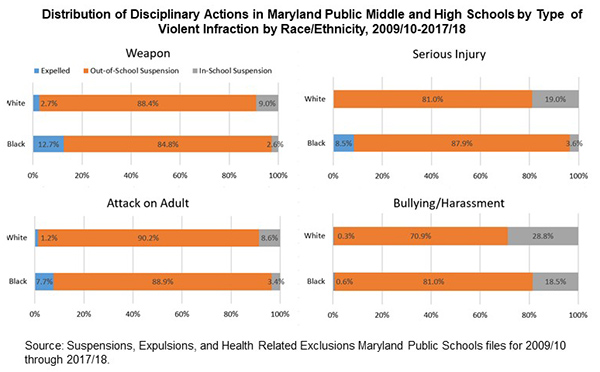
When we investigated disciplinary outcomes in response to violent infractions, we found that disparities between Black and White students persisted. For example, even when they caused serious injury, no White students were expelled for that reason from 2009 to 2018. In contrast, 8.5 percent of incidents involving serious injuries caused by Black students resulted in expulsion.
In partnership with Maryland State Department of Education (MSDE), we are building an evidence-based approach to address discipline disparities such as these. As a first step, REL Mid-Atlantic worked with MSDE to identify schools with significant discipline disparities. Now, MSDE uses these data and our report findings to inform its technical support to the local education agencies (LEAs) in which these schools operate. MSDE’s efforts to reduce and ultimately eliminate disproportionately high disciplinary removals include the following:
- Providing a tool to all LEAs to complete a root cause analysis of school discipline disparities within their districts
- Offering direct technical assistance in gathering information from varied community and school stakeholder groups to inform analyses
- Helping each LEA build a Disproportionate Review Team that best fits its unique organizational structure and ensures system-wide engagement in the process
- Designating an MSDE specialist to meet with each LEA’s Disproportionate Review Team to review and interpret all quantitative and qualitative data gathered for the root cause analysis.
For more information, visit MSDE’s disproportionate discipline webpage.
Is your agency or organization interested in joining the alliance? The alliance supports state and local efforts in the mid- Atlantic region to eliminate disparities by doing the following:
- Analyzing school discipline data to help stakeholders consistently define, measure, uncover, and monitor disproportionalities. Our analyses answer relevant questions:
- Which types of infractions are most common, and how have schools responded to these infractions?
- How do responses to infractions vary across student groups—in terms of removal type, length of removal, and services provided?
- Does the probability of being removed vary based on student race, ethnicity, or disability within schools?
- Which schools would have been identified in previous years for disproportionate discipline, and would these schools be consistently identified year after year?
- Which districts and schools should a state education agency prioritize for technical support? How can that support be differentiated?
- Helping practitioners use these analyses through coaching and consultation to explore critical policy and program implementation challenges and questions such as the following:
- What evidence-based approaches that take a school or school district’s local context into account might a state education agency employ and promote?
- How have changes in school discipline policy affected school climate and student achievement?
- What can be learned from the policies and practices of schools that do not have discipline disparities, particularly those serving large populations of Black students or students with disabilities?
To learn more, contact alliance lead Lauren Amos at lamos@mathematica-mpr.com.
References
¹ Our study calculated school-level risk ratios, a measure of within-school disparities between one subgroup and another (or all other students). Our multiple regression model explored whether Black students were more likely or at greater risk of a disciplinary removal compared with White students. We found that Black students were 4 percentage points more likely than White students to be removed, even when they committed the same offenses and attended the same schools. In addition, students with disabilities were 4 percentage points more likely to be removed than students without disabilities who attended the same schools and committed the same offenses.
² Our study found that in 2017/18, on average, Black students were removed for 30 percent longer than White students were (3.7 days compared with 2.9 days).
Cross-posted from the REL Mid-Atlantic website.