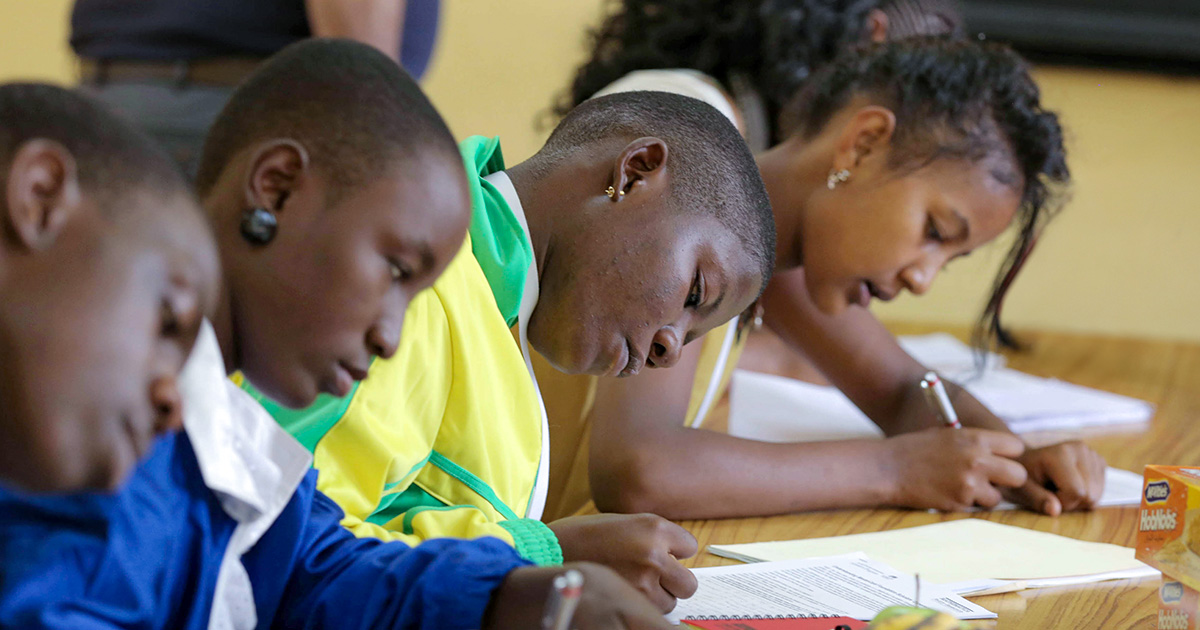
On April 7, 2021—World Health Day—the World Health Organization launched a new campaign to address the root causes of health inequity, a problem brutally highlighted by the COVID-19 pandemic. Aggravated by pre-existing medical conditions, dense living conditions, and poor health care access, even a mild health issue can quickly transform into a life-threatening condition in people and families in low-income communities. Addressing and mitigating such inequities is one of Mathematica’s core missions. We are deeply committed to shaping a more equitable and just world by offering data and evidence to create timely and effective policy solutions. We believe that the effective use of health care data can help communities adapt their response to climate change, minimizing disparities due to poverty, race, and ethnicity.
COVID-19 provides a lens for climate-related health inequity
What is true for the pandemic is equally true for the impacts of climate change—communities that are already disadvantaged bear a disproportionate share of the pain. While natural and environmental disasters may be unpredictable, their impact often is not—communities with fewer resources are less equipped to cope with them, which further exacerbates existing inequalities. For instance, poorer communities and communities of color are more likely to live in low-lying flood plains or near pollution-emitting factories. Likewise, Native Americans are six times more likely than Whites to live in areas prone to wildfires. One study found that when Hurricane Katrina struck New Orleans, damage zones were disproportionately housing residents who were Black, unemployed, or living below the poverty line.
Individual and community factors increase susceptibility to climate change
Just as exposure to natural disasters is unequal, so too is susceptibility to their health effects. At the individual level, susceptibility may be impacted by physiological factors like pre-existing conditions. At the community level, susceptibility may be magnified by topological features, the built environment, or a lack of infrastructure. For example, urban heat islands, such as those found in inner cities and communities lacking greenspaces, regularly experience temperatures several degrees higher than their suburban counterparts. In these areas, people who lack air conditioning are much more prone to potentially fatal heat strokes during a heat wave. Likewise, poor communities in public housing may be more vulnerable than their affluent neighbors to the respiratory effects of wildfires, given links between substandard living conditions and asthma, as stated in a recent American Journal of Public Health study.
Climate change can strain the capacity of health care systems
On the continuum between climate exposure and health impact, a community’s capacity to handle the fallout comes into play. Capacity can be strained because of shifting disease burdens as the climate warms. For example, the incidence of Lyme disease has doubled in the past 30 years in the United States, and warming temperatures, coupled with shorter winters, have expanded the tick habitat range and extended the tick season. As a result of such shifts in the distribution of vector-borne, tropical, and infectious diseases, hospitals across the country will need to retrain staff, and officials will need to adapt emergency plans to quickly recognize the signs and symptoms of new threats. If officials and health systems can anticipate the types of short-term surges in health care needs that climate change causes, they can better adjust their emergency preparedness and response.
Using data and analytics to build climate resilience
Understanding who is most vulnerable to climate exposures is a critical first step in developing localized adaptations. Specialized screening tools could help in this regard. For instance, CalEnviroScreen 4.0, developed by the California Office of Environmental Health Hazard Assessment, identifies California communities that are disproportionately burdened by various sources of environmental pollution. The Centers for Disease Prevention and Control’s Heat and Health Tracker shows how extreme heat events are changing over time and which counties are most at risk.
It is important to use data, like health care systems’ claims data and other health care databases, to help communities gauge where and when different health issues accumulate and how they converge with climate-related exposures. Using advanced analytics and dynamic visualizations, we’re characterizing the complex relationships between exposure, sensitivity, and capacity, and identifying who is most vulnerable to climate-related health issues. For example, by mapping heat waves and characterizing excess heat-related illnesses at the county and state levels, we are shedding light on the temperatures above which hospitalizations begin to emerge in a community. Such tools can reveal the conditions that should trigger emergency warnings to protect vulnerable residents and help communities and health systems bolster their climate resilience.
Data can be a key driver in adapting climate-related response to communities with the greatest need. By bringing those data to life through intuitive, interactive tools, Mathematica seeks to help decision makers recognize the unequal effects of climate change on impoverished communities and people of color and chart the best course of action to create a more just world.